Creating an Expected Goal table for Primera División Argentina
Categories: Expected Goals
In my previous post I presented my approach to building and testing expected goal models that I use in the future. I’ve been working with DataFactory‘s data from the Argentina Primera División, so I will apply the xG model to create a table that competition. This table is valid for matches played before this weekend (14 April 2017), so 19 matchdays have been played.
For comparison, the current league table looks like this:
| Team | GP | W | D | L | GF | GA | GD | Pts |
|---|---|---|---|---|---|---|---|---|
| Boca Juniors | 19 | 13 | 4 | 2 | 44 | 19 | 25 | 43 |
| Newell`s | 19 | 12 | 3 | 4 | 28 | 15 | 13 | 39 |
| San Lorenzo | 19 | 12 | 3 | 4 | 37 | 26 | 11 | 39 |
| Estudiantes | 19 | 11 | 4 | 4 | 34 | 19 | 15 | 37 |
| River Plate | 19 | 10 | 4 | 5 | 31 | 21 | 10 | 34 |
| Colón | 19 | 10 | 3 | 6 | 19 | 14 | 5 | 33 |
| Banfield | 19 | 10 | 3 | 6 | 27 | 24 | 3 | 33 |
| Racing Club | 18 | 10 | 2 | 6 | 31 | 21 | 10 | 32 |
| Gimnasia | 19 | 8 | 7 | 4 | 18 | 12 | 6 | 31 |
| Lanús | 19 | 8 | 5 | 6 | 23 | 21 | 2 | 29 |
| Talleres | 18 | 8 | 3 | 7 | 20 | 16 | 4 | 27 |
| Unión | 19 | 7 | 6 | 6 | 20 | 21 | -1 | 27 |
| Independiente | 17 | 6 | 7 | 4 | 17 | 12 | 5 | 25 |
| Rosario Central | 19 | 6 | 7 | 6 | 21 | 18 | 3 | 25 |
| Atlético Tucumán | 19 | 6 | 6 | 7 | 21 | 21 | 0 | 24 |
| Patronato | 19 | 7 | 3 | 9 | 21 | 24 | -3 | 24 |
| Def. y Justicia | 18 | 6 | 5 | 7 | 16 | 18 | -2 | 23 |
| Temperley | 19 | 5 | 8 | 6 | 18 | 23 | -5 | 23 |
| Godoy Cruz | 19 | 7 | 2 | 10 | 19 | 26 | -7 | 23 |
| Atlético Rafaela | 19 | 6 | 4 | 9 | 18 | 21 | -3 | 22 |
| Tigre | 18 | 5 | 6 | 7 | 23 | 24 | -1 | 21 |
| Olimpo | 19 | 4 | 9 | 6 | 16 | 17 | -1 | 21 |
| Huracán | 19 | 4 | 8 | 7 | 14 | 17 | -3 | 20 |
| Aldosivi | 19 | 4 | 8 | 7 | 13 | 20 | -7 | 20 |
| Vélez | 19 | 5 | 4 | 10 | 16 | 29 | -13 | 19 |
| Quilmes | 19 | 5 | 4 | 10 | 14 | 30 | -16 | 19 |
| Sarmiento | 19 | 4 | 6 | 9 | 18 | 23 | -5 | 18 |
| San Martín (SJ) | 19 | 3 | 8 | 8 | 16 | 30 | -14 | 17 |
| Belgrano | 19 | 2 | 7 | 10 | 11 | 21 | -10 | 13 |
| Arsenal | 19 | 1 | 5 | 13 | 15 | 36 | -21 | 8 |
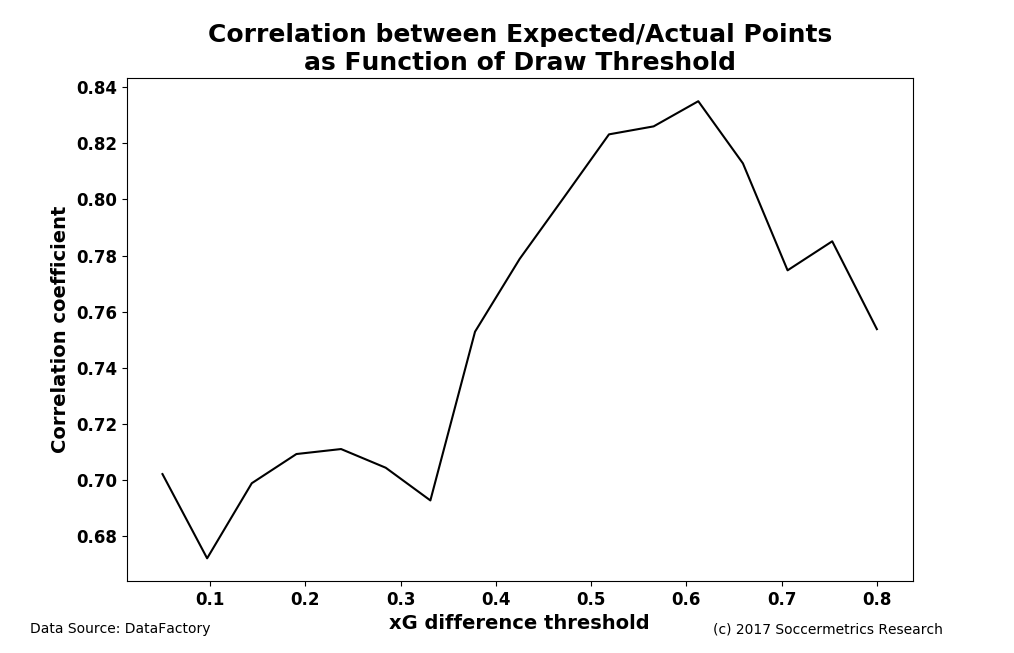
The table is generated by evaluating total expected goals for each match. If the difference between total goals is exceeds a given draw threshold (between 0.05 and 0.9 goals), a win and loss are assigned; otherwise, the match is judged a draw. The threshold influences the number of draws in the table and the correlation between expected and actual points, and the below chart illustrates the relationship between these values. I’ve decided to use 0.5 goals as a threshold for deciding draws.
Here is the table based on expected goals. Boca Juniors is a clear and deserved leader of the competition, and Arsenal is firmly at the bottom of the table (and in danger of relegation). Beyond that, the tournament is characterized by the apparent overperformance of Newell’s Old Boys, Gimnasia, Banfield, and Colón and the photographic negative in Racing and Atlético Rafaela. I still need to do a deep dive into the data to figure out what’s going on, but from reading a few press reports there may be some correlation with ground truth.
| Team | GP | W | D | L | GF | GA | GD | Pts |
|---|---|---|---|---|---|---|---|---|
| Boca Juniors | 19 | 12 | 5 | 2 | 31.4 | 16.4 | 15.0 | 41 |
| Racing Club | 18 | 11 | 5 | 2 | 23.6 | 14.1 | 9.5 | 38 |
| Estudiantes | 19 | 9 | 8 | 2 | 25.9 | 15.0 | 10.9 | 35 |
| River Plate | 19 | 9 | 7 | 3 | 23.9 | 17.0 | 6.9 | 34 |
| San Lorenzo | 19 | 7 | 11 | 1 | 24.2 | 16.8 | 7.4 | 32 |
| Newell`s | 19 | 7 | 7 | 5 | 19.1 | 16.4 | 2.7 | 28 |
| Independiente | 17 | 6 | 9 | 2 | 18.9 | 14.6 | 4.3 | 27 |
| Unión | 19 | 6 | 9 | 4 | 22.7 | 18.6 | 4.1 | 27 |
| Lanús | 19 | 6 | 9 | 4 | 17.9 | 16.7 | 1.2 | 27 |
| Rosario Central | 19 | 6 | 9 | 4 | 20.2 | 19.2 | 1.0 | 27 |
| Atlético Rafaela | 19 | 4 | 14 | 1 | 18.2 | 15.5 | 2.7 | 26 |
| Talleres | 18 | 6 | 8 | 4 | 18.3 | 16.2 | 2.1 | 26 |
| Banfield | 19 | 6 | 8 | 5 | 18.9 | 16.9 | 2.0 | 26 |
| Colón | 19 | 5 | 11 | 3 | 20.4 | 21.6 | -1.2 | 26 |
| Tigre | 18 | 6 | 7 | 5 | 20.8 | 20.5 | 0.3 | 25 |
| Patronato | 19 | 5 | 8 | 6 | 19.7 | 19.6 | 0.1 | 23 |
| Aldosivi | 19 | 4 | 11 | 4 | 18.6 | 22.8 | -4.2 | 23 |
| Atlético Tucumán | 19 | 4 | 10 | 5 | 20.9 | 22.1 | -1.2 | 22 |
| Sarmiento | 19 | 4 | 10 | 5 | 18.4 | 23.7 | -5.3 | 22 |
| Def. y Justicia | 18 | 3 | 12 | 3 | 19.0 | 16.6 | 2.4 | 21 |
| Huracán | 19 | 3 | 10 | 6 | 16.6 | 22.9 | -6.3 | 19 |
| Gimnasia | 19 | 2 | 12 | 5 | 16.4 | 20.9 | -4.5 | 18 |
| Temperley | 19 | 3 | 8 | 8 | 17.8 | 21.9 | -4.1 | 17 |
| Quilmes | 19 | 3 | 8 | 8 | 18.5 | 25.0 | -6.5 | 17 |
| Belgrano | 19 | 2 | 10 | 7 | 16.2 | 18.9 | -2.7 | 16 |
| Vélez | 19 | 2 | 10 | 7 | 15.7 | 21.3 | -5.6 | 16 |
| Godoy Cruz | 19 | 2 | 9 | 8 | 19.9 | 23.5 | -3.6 | 15 |
| Olimpo | 19 | 1 | 12 | 6 | 16.1 | 20.4 | -4.3 | 15 |
| San Martín (SJ) | 19 | 1 | 8 | 10 | 15.2 | 25.4 | -10.2 | 11 |
| Arsenal | 19 | 1 | 7 | 11 | 15.4 | 28.3 | -12.9 | 10 |
