How do Leicester City compare to previous English football champions?
Categories: League Competitions, Team Performance
Leicester City are the new champions of England by merit of their own high performance and the surprisingly less than expected performance of the usual contenders for the Premier League title. Over the last few months, as Leicester’s title run began to be taken more seriously, there has been some discussion in the press about where their performance fits in the pantheon of previous league winners, but some of that discussion looked entirely at points, which is very misleading because of the changes to the top-flight competition over the last 125 years.
I’ve compiled the point totals won by all of the English league champions from the creation of the Football League (and eventual First Division) to the Premier League era. The top-flight has always been a double round-robin competition, but the competition formats have changed frequently over the years (there were no competitions during the First and Second World Wars):
| Seasons | Teams | Points/Win |
| 1888-89 to 1890-91 | 12 | 2 |
| 1891-92 | 14 | 2 |
| 1892-93 to 1897-98 | 16 | 2 |
| 1898-99 to 1904-05 | 18 | 2 |
| 1905-06 to 1914-15 | 20 | 2 |
| 1919-20 to 1980-81 | 22 | 2 |
| 1981-82 to 1986-87 | 22 | 3 |
| 1987-88 | 21 | 3 |
| 1988-89 to 1989-90 | 20 | 3 |
| 1990-91 to 1994-95 | 22 | 3 |
| 1995-96 to Present | 20 | 3 |
That’s a total of eleven different formats for the top-flight competition in England when you consider the number of teams involved and points per win. So unless one chooses to compare points solely from one period, comparing points between periods makes little sense. And it’s worth noticing that the Premier League era straddles two of the these periods.
Instead of looking at points, I calculate the percentage of points won, which is nothing more than the total points won divided by the total points available. The result is a metric that can be used to compare champions across the changes in competition formats.
So here’s the histogram of the the percentage of points won by all champions of England, from the 1888-89 season to the present (as of this post, Leicester City have 80 points from 37 matches):
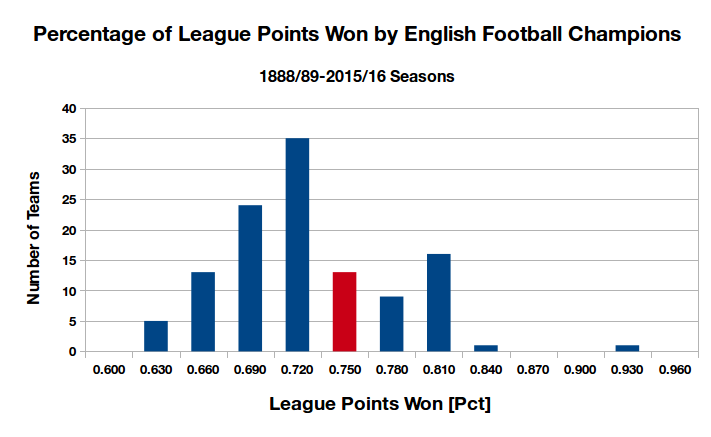
Percentage of available league points won by English top-flight football champions. (Leicester City’s point percentage is in the red block.)
English football champions run the gamut from Everton’s 1914-15 side which won the league with 46 points from 38 matches (60.5% of points available) to Preston North End’s Invincibles which won the original 1888-89 Football League with 40 points from 22 matches (90.9% of points available). In general, the distribution of champions is bimodal — one large peak at around 70-72% of possible points won, and a smaller peak at 79-81% of possible points won. You could describe the peaks as “Typical Champions” and “Dominant Champions”, with exceptions scattered on either side of each peak.
Where does Leicester City fit in? If you only consider the Premier League era, Leicester’s point total doesn’t look that impressive. As of today, there are eight previous Premier League champions that have won a lower percentage of available points — Manchester United (1992-93, 1995-96, 1996-97, 1998-99, 2000-01, 2010-11), Blackburn Rovers (1994-95), and Arsenal (1997-98). If Leicester lose to Chelsea, only four Premier League champions would have earned a worse percentage (Manchester United in 1992-93, 1996-97, and 1998-99, and Arsenal in 1997-98). But if you expand the view to the three-points-per-win era (from 1981-82 to present), Leicester’s percentage of points win is in the 53rd percentile, and over the entire existence of top-flight football in England, Leicester’s performance is in the 66th percentile. It is worth noting that their final rank relative to other English champions is very sensitive on their result against Chelsea: a win moves their performance to the 70th percentile; a draw drops them to the 55th percentile and a loss drop them down to the 48th percentile.
Comparing champions across eras (and even over a similar era) is often a fruitless exercise. But if one wishes to consider point totals won when comparing champions, it’s best to renormalize them to reduce the influence of the competition format. I’ll close with what Howard Wilkinson said shortly after his Leeds United side won the last First Division title in 1991-92 because I feel it applies so well to Leicester City: they’ve never claimed that they were the best team to ever win the title, or the best team that’s ever going to win the title, but they have gone out and won it, and would like to be able to enjoy it.
UPDATE (19:20, 15 May): The last round of the 2015-16 Premier League is now over, save for one match. Leicester drew 1-1 to Chelsea, so their final point total places them in the 55th percentile among the other English football champions. It’s right in line with the typical performance of league champions, but the point total is less than recent Premier League champions. Here’s the updated histogram:
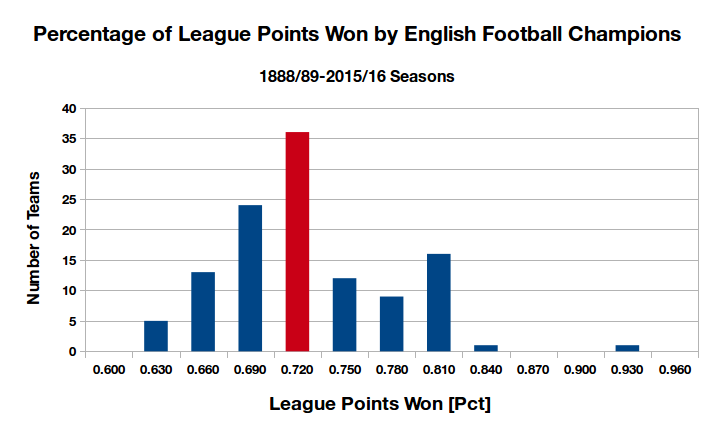
Percentage of available league points won by English top-flight football champions. (Leicester City’s point percentage is in the red block.)
