Assessing the Projections: 2014-15 English Premier League
Categories: League Competitions
The preseason projections for the 2014-15 English Premier League generated a lot of interest, and an equal amount of criticism. It’s been a long nine months since the season started, and now that we’re at its end, it’s time to evaluate the league projections against the final reality.
There are many people who are coming to this page for the first time, so I’ll explain briefly how the projections are made. They are Pythagorean expectations of the projected goals scored and allowed that Aaron Nielsen creates at the start of league competitions. It’s certainly not a perfect projection, and I can discuss my own issues with it at a future time, but it is useful for learning more about sport projections and understanding just how difficult such an endeavor really is.
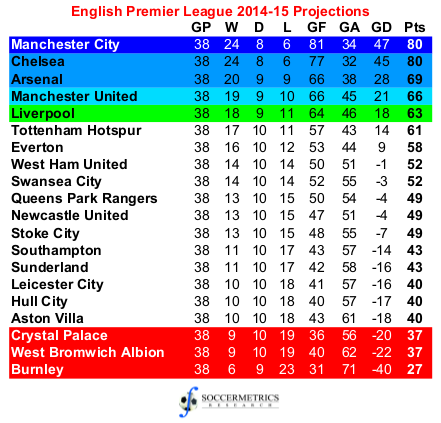
As was done with the Eredivisie, there were two league projections made. The first projection was made before the start of the league season. It indicates a too-close-to-call race between Manchester City and Chelsea, with Arsenal, Manchester United, and Liverpool further behind. West Brom, Crystal Palace, and newly promoted Burnley were projected for the drop. But the biggest surprise to many was West Ham in eighth place.
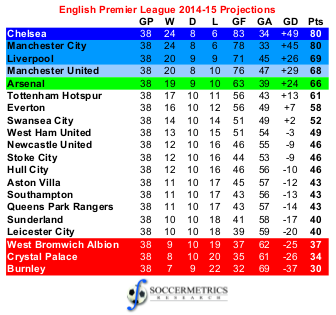
The second projection was made at the conclusion of the summer transfer window on 1 Sept 2014. It was still too-close-to-call at the top, but a slight advantage toward Chelsea. We expected Liverpool’s acquisitions to add seven goals to their expected goals scored, which had a significant impact on their expected point total and vaulted them in third place over Manchester United and Arsenal. The same teams were projected for the bottom three, but we were more optimistic about Hull City and Aston Villa and more pessimistic about QPR, Sunderland, and Leicester City.
The final league table looks like this:
| Club | GP | W | D | L | GF | GA | GD | Pts |
| Chelsea | 38 | 26 | 9 | 3 | 73 | 32 | 41 | 87 |
| Manchester City | 38 | 24 | 7 | 7 | 83 | 38 | 45 | 79 |
| Arsenal | 38 | 22 | 9 | 7 | 71 | 36 | 35 | 75 |
| Manchester United | 38 | 20 | 10 | 8 | 62 | 37 | 25 | 70 |
| Tottenham Hotspur | 38 | 19 | 7 | 12 | 58 | 53 | 5 | 64 |
| Liverpool | 38 | 18 | 8 | 12 | 52 | 48 | 4 | 62 |
| Southampton | 38 | 18 | 6 | 14 | 54 | 33 | 21 | 60 |
| Swansea City | 38 | 16 | 8 | 14 | 46 | 49 | -3 | 56 |
| Stoke City | 38 | 15 | 9 | 14 | 48 | 45 | 3 | 54 |
| Crystal Palace | 38 | 13 | 9 | 16 | 47 | 51 | -4 | 48 |
| Everton | 38 | 12 | 11 | 15 | 48 | 50 | -2 | 47 |
| West Ham United | 38 | 12 | 11 | 15 | 44 | 47 | -3 | 47 |
| West Bromwich Albion | 38 | 11 | 11 | 16 | 38 | 51 | -13 | 44 |
| Leicester City | 38 | 11 | 8 | 19 | 46 | 55 | -9 | 41 |
| Newcastle United | 38 | 10 | 9 | 19 | 40 | 63 | -23 | 39 |
| Sunderland | 38 | 7 | 17 | 14 | 31 | 53 | -22 | 38 |
| Aston Villa | 38 | 10 | 8 | 20 | 31 | 57 | -26 | 38 |
| Hull City | 38 | 8 | 11 | 19 | 33 | 51 | -18 | 35 |
| Burnley | 38 | 7 | 12 | 19 | 28 | 53 | -25 | 33 |
| Queens Park Rangers | 38 | 8 | 6 | 24 | 42 | 73 | -31 | 30 |
After a first half of the season that presented a one-match playoff as a possibility, Chelsea pulled away from Manchester City to win the title. If we assume that the projected goals totals reflect accurately the relative strengths of the teams (not sure I believe that but useful for the sake of argument), Chelsea ran well ahead of their expected point total despite scoring ten fewer goals than expected. Was it luck, or were there other factors? I’ll come back to that question later in the post.
I was very impressed that the projection identified the top six teams in the league, although not necessarily in the correct order. The projection made after the summer transfer window turned out to be overly optimistic about the goal output of Manchester United and Liverpool, and I’m guessing that the estimates took into account the Falcao and Balotelli transfers. Falcao’s lack of production was offset somewhat by the contributions of Herrera, Mata, and Fellaini, but the lack of production from Balotelli and Lambert, as well as the decline of Gerrard and the injuries to Sturridge, meant that Liverpool were never going to recover the goal output of the previous season. As for Arsenal, they didn’t run that far ahead of goal projections — five more goals scored than expected, two fewer goals allowed than expected — but they did win six more points than expected. Perhaps there was some luck in that result as well.
In the middle third of the table were Southampton, Stoke City, Crystal Palace, and West Brom, all clubs that significantly outperformed their preseason projected finishes. Southampton had sold off the bulk of the players who starred in their 8th place finish in 2013-14, and their expected goal statistics were way down (and up, defensively) as a result. They ran the furthest ahead of their projected totals — 11 more goals scored, 23 fewer goals allowed, and 17 more points won than projected on their way to a seventh-place finish. Stoke were expected to finish 12th, and in reality their defensive performance was eight goals better than projected and their offensive performance four goals better than projected. The point difference was just five points, but in the middle of the table a small difference between points earned and predicted can make a huge difference in final placing. Crystal Palace were expected to go down, and it certainly looked that way after Tony Pulis left and the club were in the relegation zone on New Year’s Day. In the end, Palace finished nine places above their expected finish, with 14 more points, 12 more goals scored, and ten fewer goals allowed than projected. Tony Pulis landed at West Brom in January when they were just above the relegation zone and they ended up allowing 11 fewer goals than expected on their way to a mid-table finish.
By far the projection that attracted the most comment and criticism was West Ham in ninth place. The projection came down to the acquisition of Valencia and Sakho, which we felt would contribute significantly to their goalscoring. West Ham did in fact perform very well during the first half of the season, to the point that they had an outside chance of qualifying for European competition. A late-season dropoff in scoring and performance sent West Ham to 12th place, four places worse than projected. I still think that the projection for West Ham was a good one. The estimated goal statistics weren’t off by a large amount — less than ten goals — and the expected point total was two points off. West Ham might have finished ninth had it not been for Crystal Palace, Stoke, or Southampton, but so many things change over the course of a season.
Toward the bottom are teams that flirted with relegation danger and confirmed their safety in the final weeks, such as Leicester City, Sunderland, and Newcastle United. Leicester City and Sunderland were actually close to where we expected them to be, but Leicester’s final position was buoyed by the under-performances of Newcastle United and Aston Villa. The relegation zone was filled by Hull City, Queens Park Rangers, and Burnley, and of these sides only Burnley were not a surprise. In fact, Burnley played much better defensively than we projected and about in line offensively, but they just weren’t good enough to survive. When you look at the bottom of the table, you see that teams found themselves there by different means. It could be a lack of any offensive output (Sunderland, Villa, Hull), a defensive collapse (QPR), or problems on both sides of the ball (Newcastle United).
The effect of the later projection was to tighten the estimation error of expected final position in the table and the expected goals allowed. Overall I think we were over-optimistic about the output of certain players who were brought into the league from abroad, which was reflected in the 5% difference between expected and actual goals scored in the league, so maybe some adjustment for transitions between leagues is in order. I was impressed that the range of points between top and bottom matched the league projections much more closely (30-87 points vs 30-80 points),
Below is a Pythagorean expectation with the final goal statistics of the Premier League teams:
| Club | GP | W | D | L | GF | GA | GD | Pts | xW | xD | xL | xPts | Δ |
| Chelsea | 38 | 26 | 9 | 3 | 73 | 32 | 41 | 87 | 23 | 9 | 6 | 78 | +9 |
| Manchester City | 38 | 24 | 7 | 7 | 83 | 38 | 45 | 79 | 23 | 8 | 7 | 77 | +2 |
| Arsenal | 38 | 22 | 9 | 7 | 71 | 36 | 35 | 75 | 22 | 9 | 7 | 75 | +0 |
| Manchester United | 38 | 20 | 10 | 8 | 62 | 37 | 25 | 70 | 20 | 10 | 8 | 70 | +0 |
| Tottenham Hotspur | 38 | 19 | 7 | 12 | 58 | 53 | 5 | 64 | 15 | 9 | 14 | 54 | +10 |
| Liverpool | 38 | 18 | 8 | 12 | 52 | 48 | 4 | 62 | 15 | 10 | 13 | 55 | +7 |
| Southampton | 38 | 18 | 6 | 14 | 54 | 33 | 21 | 60 | 19 | 11 | 8 | 68 | -8 |
| Swansea City | 38 | 16 | 8 | 14 | 46 | 49 | -3 | 56 | 13 | 10 | 15 | 49 | +7 |
| Stoke City | 38 | 15 | 9 | 14 | 48 | 45 | 3 | 54 | 14 | 11 | 13 | 53 | +1 |
| Crystal Palace | 38 | 13 | 9 | 16 | 47 | 51 | -4 | 48 | 13 | 10 | 15 | 49 | -1 |
| Everton | 38 | 12 | 11 | 15 | 48 | 50 | -2 | 47 | 13 | 10 | 15 | 49 | -2 |
| West Ham United | 38 | 12 | 11 | 15 | 44 | 47 | -3 | 47 | 13 | 11 | 14 | 50 | -3 |
| West Bromwich Albion | 38 | 11 | 11 | 16 | 38 | 51 | -13 | 44 | 11 | 11 | 16 | 44 | +0 |
| Leicester City | 38 | 11 | 8 | 19 | 46 | 55 | -9 | 41 | 12 | 10 | 16 | 46 | -5 |
| Newcastle United | 38 | 10 | 9 | 19 | 40 | 63 | -23 | 39 | 9 | 9 | 20 | 36 | +3 |
| Sunderland | 38 | 7 | 17 | 14 | 31 | 53 | -22 | 38 | 8 | 11 | 19 | 35 | +3 |
| Aston Villa | 38 | 10 | 8 | 20 | 31 | 57 | -26 | 38 | 8 | 10 | 20 | 34 | +4 |
| Hull City | 38 | 8 | 11 | 19 | 33 | 51 | -18 | 35 | 9 | 11 | 18 | 38 | -3 |
| Burnley | 38 | 7 | 12 | 19 | 28 | 53 | -25 | 33 | 7 | 11 | 20 | 32 | +1 |
| Queens Park Rangers | 38 | 8 | 6 | 24 | 42 | 73 | -31 | 30 | 9 | 9 | 20 | 36 | -6 |
The important thing to understand about the Pythagorean is that is expressed the expected point total of an average team with certain goal statistics. Now, some teams are better or worse than average, so it’s not clear how much of the Pythagorean residual reflects luck or a true over- or under-performance. Nevertheless, the teams with the highest positive Pythagorean residuals were Tottenham, Chelsea, Liverpool, and Swansea City. The teams with the highest negative Pythagorean residuals: Leicester City, Queens Park Rangers, and Southampton. I believe that the Pythagorean expectation is saying the following:
- Chelsea and Manchester City should have been a much closer fight for the title, with Arsenal not too far behind.
- There should have been a lot more distance between Southampton and Liverpool/Spurs.
- Moreover, Southampton could have challenged Manchester United for fourth place and a Champions League playoff place.
- Crystal Palace and West Brom earned their mid-table places.
- How did Sunderland and Aston Villa manage to stay up?
I found it interesting that the Manager of the Season — Jose Mourinho — was in charge of the team with the second-highest Pythagorean residual. I find it even more interesting that of the last three Managers of the Season, two of them — Sir Alex Ferguson and Alan Pardew — were running the most overachieving teams in the Premier League, but more about that in a future post.
So here’s the statistical summary of the first projected table:
| Total Goals | Pred Goals | Pct Change | Pct Draws | RMSE Pts | RMSE GF | RMSE GA | RMSE Pos |
| 975 | 1027 | -5.06% | 24.47% | 8.09 | 7.11 | 10.02 | 3.92 |
and the summary of the second table:
| Total Goals | Pred Goals | Pct Change | Pct Draws | RMSE Pts | RMSE GF | RMSE GA | RMSE Pos |
| 975 | 1036 | -5.89% | 24.47% | 8.09 | 9.32 | 9.36 | 3.78 |
